Oracle JETやその他のチャート描画ライブラリの組み込み作業で表示したチャートと、同じチャートを表示してみます。
直接billboard.jsで描画
https://cdn.jsdelivr.net/npm/d3/dist/d3.min.js
https://cdn.jsdelivr.net/npm/billboard.js/dist/billboard.min.js
CSSのファイルURLに以下を記述します。
https://cdn.jsdelivr.net/npm/billboard.js/dist/billboard.min.css
静的コンテンツのリージョンの名前をbillboard.jsとし、ソースのHTMLコードに以下を記述します。
<div id="myChart"></div>
チャートに描画するデータを保持するページ・アイテムとしてP1_VALUEを作成します。タイプは非表示です。
ページ・アイテムP1_VALUEに計算を作成し、ページの描画前にデータを設定します。計算のタイプとしてSQL問合せ(単一の値を返す)を選択し、SQL問合せに以下を記述します。
select
json_arrayagg(
json_object(
'ename' value ename,
'sal' value sal
)
order by empno asc )
from emp where deptno = 10
チャートを描画するJavaScriptのコードを、ページ・プロパティのページ・ロード時に実行に記述します。
This file contains bidirectional Unicode text that may be interpreted or compiled differently than what appears below. To review, open the file in an editor that reveals hidden Unicode characters.
Learn more about bidirectional Unicode characters
/* | |
* specify y-axis and x-axis separed by commna. | |
*/ | |
const groups = 'ename,sal'; | |
const groupsArr = groups.split(","); | |
const categoryY = groupsArr[0].trim(); // category | |
const valueX = groupsArr[1].trim(); // value | |
/* | |
* value array : [ { "ename": "...", "sal": 333 }, { ... } ] | |
*/ | |
const value = JSON.parse(apex.items.P1_VALUE.value); | |
let categoryYarr = [ categoryY ]; // for category | |
let valueXarr = [ valueX ]; // for value | |
value.forEach( (e) => { | |
categoryYarr.push(e[categoryY]); | |
valueXarr.push(e[valueX]); | |
}); | |
let colorDef = {}; | |
colorDef[valueX] = "#309fdb"; | |
/* | |
* Draw Bar Chart. | |
*/ | |
var chart = bb.generate({ | |
bindto: "#myChart", | |
data: { | |
x: categoryY, | |
type: "bar", | |
columns: [ | |
categoryYarr, | |
valueXarr | |
], | |
colors: colorDef | |
}, | |
axis: { | |
x: { | |
type: "category" | |
}, | |
rotated: true | |
}, | |
legend: { | |
hide: valueX | |
}, | |
bar: { | |
width: { | |
ratio: 0.5 | |
} | |
} | |
}); |
以上で実装は完了です。ページを実行すると以下のように表示されます。
テンプレート・コンポーネントの作成
テンプレート・コンポーネントの名前はbillboard.js Bar Chartとしました。テンプレートの部分には以下を記述しています。
This file contains bidirectional Unicode text that may be interpreted or compiled differently than what appears below. To review, open the file in an editor that reveals hidden Unicode characters.
Learn more about bidirectional Unicode characters
<div class="#CSS_CLASSES#"> | |
<a-billboard-js-bar-chart id="#APEX$DOM_ID#" groups="#GROUPS#" value="#VALUE#" color="#COLOR#" orientation="#ORIENTATION#" width="#WIDTH#" height="#HEIGHT#"></a-billboard-js-bar-chart> | |
</div> |
カスタム属性Orientationの静的LOVとして、horizontalの戻り値にtrue、verticalの戻り値にfalseを設定します。これはaxis属性のrotatedの値になります。
ディレクトリをjs、ファイル名をscript.jsとして、カスタム要素a-billboard-js-bar-chartの実装を記述します。
This file contains bidirectional Unicode text that may be interpreted or compiled differently than what appears below. To review, open the file in an editor that reveals hidden Unicode characters.
Learn more about bidirectional Unicode characters
(function (debug) { | |
"use strict"; | |
class BillboardJsBarChart extends HTMLElement { | |
chart; | |
chartId; | |
constructor() { | |
super(); | |
this.chartId = new Date().getTime(); | |
debug.info("%s, constructor", this.chartId); | |
} | |
connectedCallback() { | |
debug.info("%s, %s, connectedCallback, %s", this.chartId, new Date().getTime(), this.isConnected); | |
if (this.isConnected) { | |
/* prepare div for chart region */ | |
const div = document.createElement("div"); | |
const width = this.getAttribute("width"); | |
if ( width ) { | |
div.classList.add(`w${width}`); | |
}; | |
const height = this.getAttribute("height"); | |
if ( height ) { | |
div.classList.add(`h${height}`); | |
}; | |
this.appendChild(div); | |
/* | |
* specify y-axis and x-axis separed by commna. | |
*/ | |
const groups = this.getAttribute("groups"); | |
const groupsArr = groups.split(","); | |
const categoryY = groupsArr[0].trim(); // category | |
const valueX = groupsArr[1].trim(); // value | |
/* | |
* value array : [ { "ename": "...", "sal": 333 }, { ... } ] | |
*/ | |
const value = JSON.parse(this.getAttribute("value")); | |
let categoryYarr = [ categoryY ]; // for category | |
let valueXarr = [ valueX ]; // for value | |
value.forEach( (e) => { | |
categoryYarr.push(e[categoryY]); | |
valueXarr.push(e[valueX]); | |
}); | |
const color = this.getAttribute("color"); | |
let colorDef = {}; | |
if ( color ) { | |
colorDef[valueX] = color; | |
}; | |
const orientation = this.getAttribute("orientation"); | |
let orientationDef = true; | |
if ( orientation === null || orientation === "false" ) { | |
orientationDef = false; | |
}; | |
/* | |
* create config. | |
*/ | |
let config = { | |
bindto: div, | |
data: { | |
x: categoryY, | |
type: "bar", | |
columns: [ | |
categoryYarr, | |
valueXarr | |
], | |
colors: colorDef | |
}, | |
axis: { | |
x: { | |
type: "category" | |
}, | |
rotated: orientationDef | |
}, | |
legend: { | |
hide: valueX | |
}, | |
bar: { | |
width: { | |
ratio: 0.5 | |
} | |
} | |
}; | |
debug.info(config); | |
/* | |
* Draw Bar Chart. | |
*/ | |
var chart = bb.generate(config); | |
this.chart = chart; | |
} | |
} | |
disconnectedCallback() { | |
debug.info("%s, %s, disconnectedCallback", this.chartId, new Date().getTime()); | |
if (this.firstChild) { | |
this.removeChild(this.firstChild); | |
} | |
} | |
} | |
document.addEventListener('DOMContentLoaded', () => { | |
if ( window.customElements.get("a-billboard-js-bar-chart") === undefined ) { | |
debug.info("define custom element"); | |
window.customElements.define("a-billboard-js-bar-chart", BillboardJsBarChart); | |
}; | |
}); | |
})(apex.debug); |
ロードするファイルURLのカスケード・スタイルシートに以下を記述します。
https://cdn.jsdelivr.net/npm/billboard.js/dist/billboard.min.css
JavaScriptに以下を記述します。
https://cdn.jsdelivr.net/npm/d3/dist/d3.min.js
https://cdn.jsdelivr.net/npm/billboard.js/dist/billboard.min.js
#PLUGIN_FILES#js/script#MIN#.js
以上でテンプレート・コンポーネントは完成です。
リージョンにbillboard.jsのテンプレート・コンポーネントを実装します。
ページ・アイテムP2_VALUEは、最初に作成したP1_VALUEと同じ設定で作成します。
識別の名前をbillboard.js、タイプをbillboard.js Bar Chartとします。
リージョンの属性を開き、Groupsとしてename,sal、ValueとしてP2_VALUE、Colorとして#309fdbを設定します。Orientationはhorizontalです。
対話モード・レポートへの組み込み
select
dname,
json_arrayagg(
json_object(
'ename' value ename,
'sal' value sal
)
order by empno asc ) value,
'' chart
from emp_dept_v group by dname
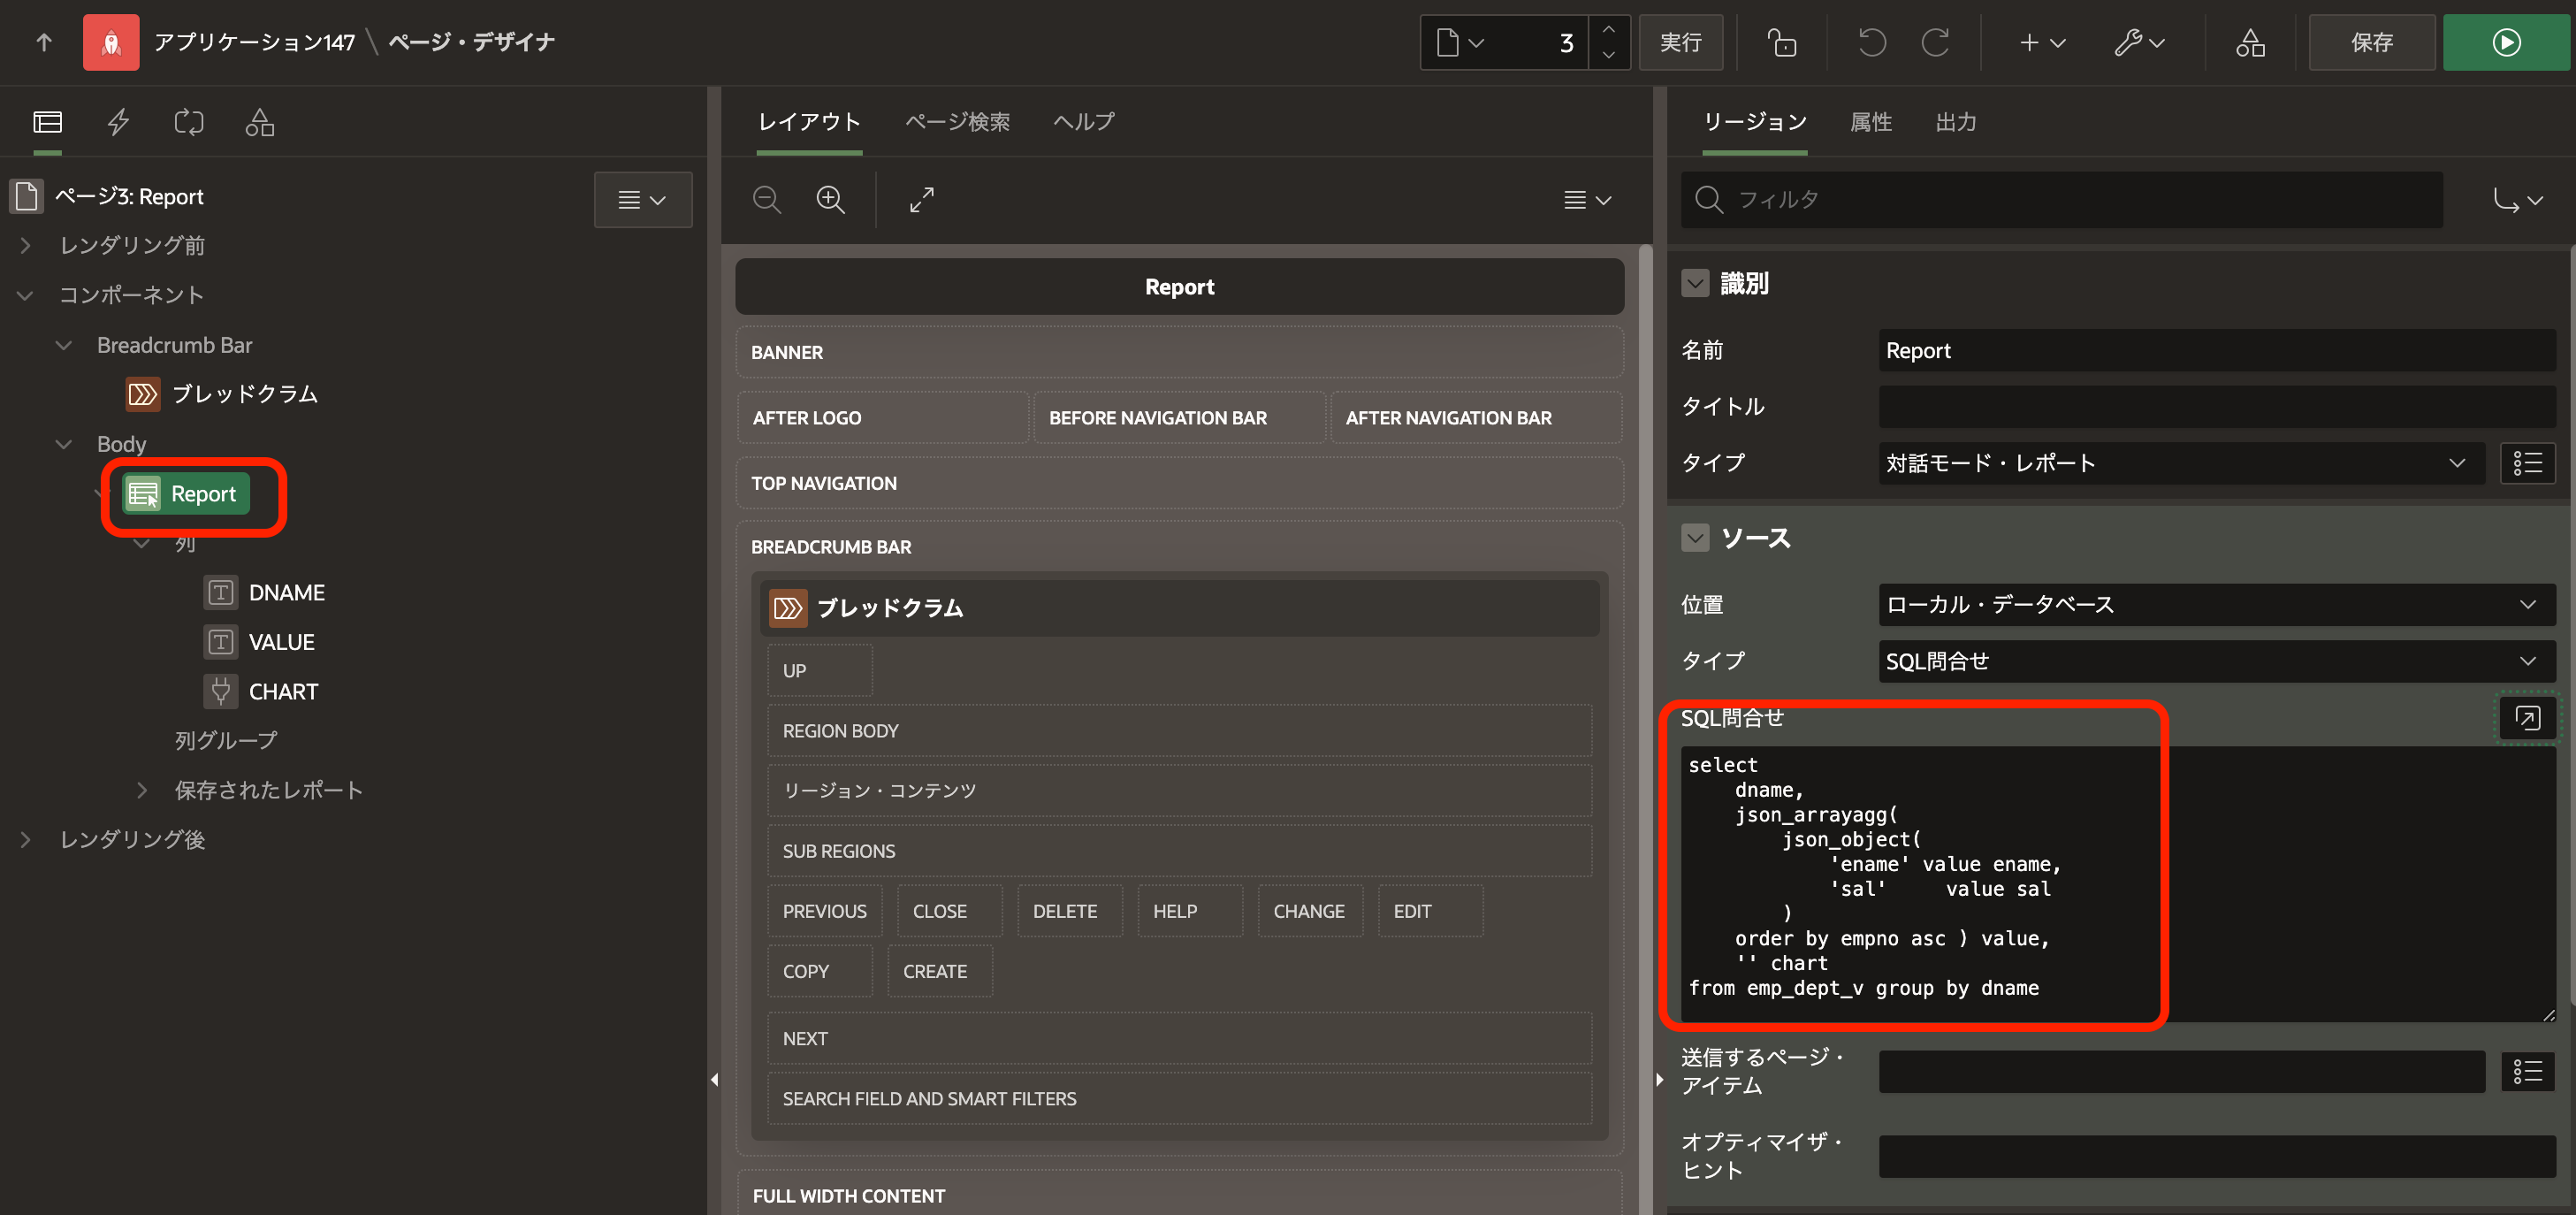
対話モード・レポートの列CHARTを選択し、識別のタイプをbillboard.js Bar Chartに変更します。
設定のGroupsにename,sal、ValueにVALUE、Colorに#309fdb、Orientationにhorizontalを設定します。Widthは400、Heightに200を設定します。
以上で実装は完了です。ページを実行すると以下のように表示されます。
今回の記事は以上になります。
作成したAPEXアプリケーションのエクスポートを以下に置きました。
https://github.com/ujnak/apexapps/blob/master/exports/integrating-billboard-js.zip
Oracle APEXのアプリケーション作成の参考になれば幸いです。
完