Oracle JETやその他のチャート描画ライブラリの組み込み作業で表示したチャートと、同じチャートを表示してみます。HighchartsはSVGを使ってチャートを描画するため、ESモジュールを使用します。
直接Highchartsで描画
Highcharts file serviceにアクセスし、ページの一番下のECMASCRIPT MODULESを確認します。
HighchartsをESモジュールとして読み込むURLは以下でした。
https://code.highcharts.com/es-modules/masters/highcharts.src.js
ページ・プロパティのHTMLヘッダーにimportmapを記述します。Highchartsは、別名highchartsを指定してインポートできるようになります。
<script type="importmap">
{
"imports": {
"highcharts": "https://code.highcharts.com/es-modules/masters/highcharts.src.js"
}
}
</script>
チャートに描画するデータを保持するページ・アイテムとしてP1_GROUPS、P1_VALUEを作成します。タイプは非表示です。
ページ・アイテムP1_GROUPSに計算を作成し、ページの描画前にデータを設定します。計算のタイプとしてSQL問合せ(単一の値を返す)を選択し、SQL問合せに以下を記述します。
select
json_arrayagg(
ename
order by empno asc )
from emp where deptno = 10
select
json_arrayagg(
sal
order by empno asc )
from emp where deptno = 10
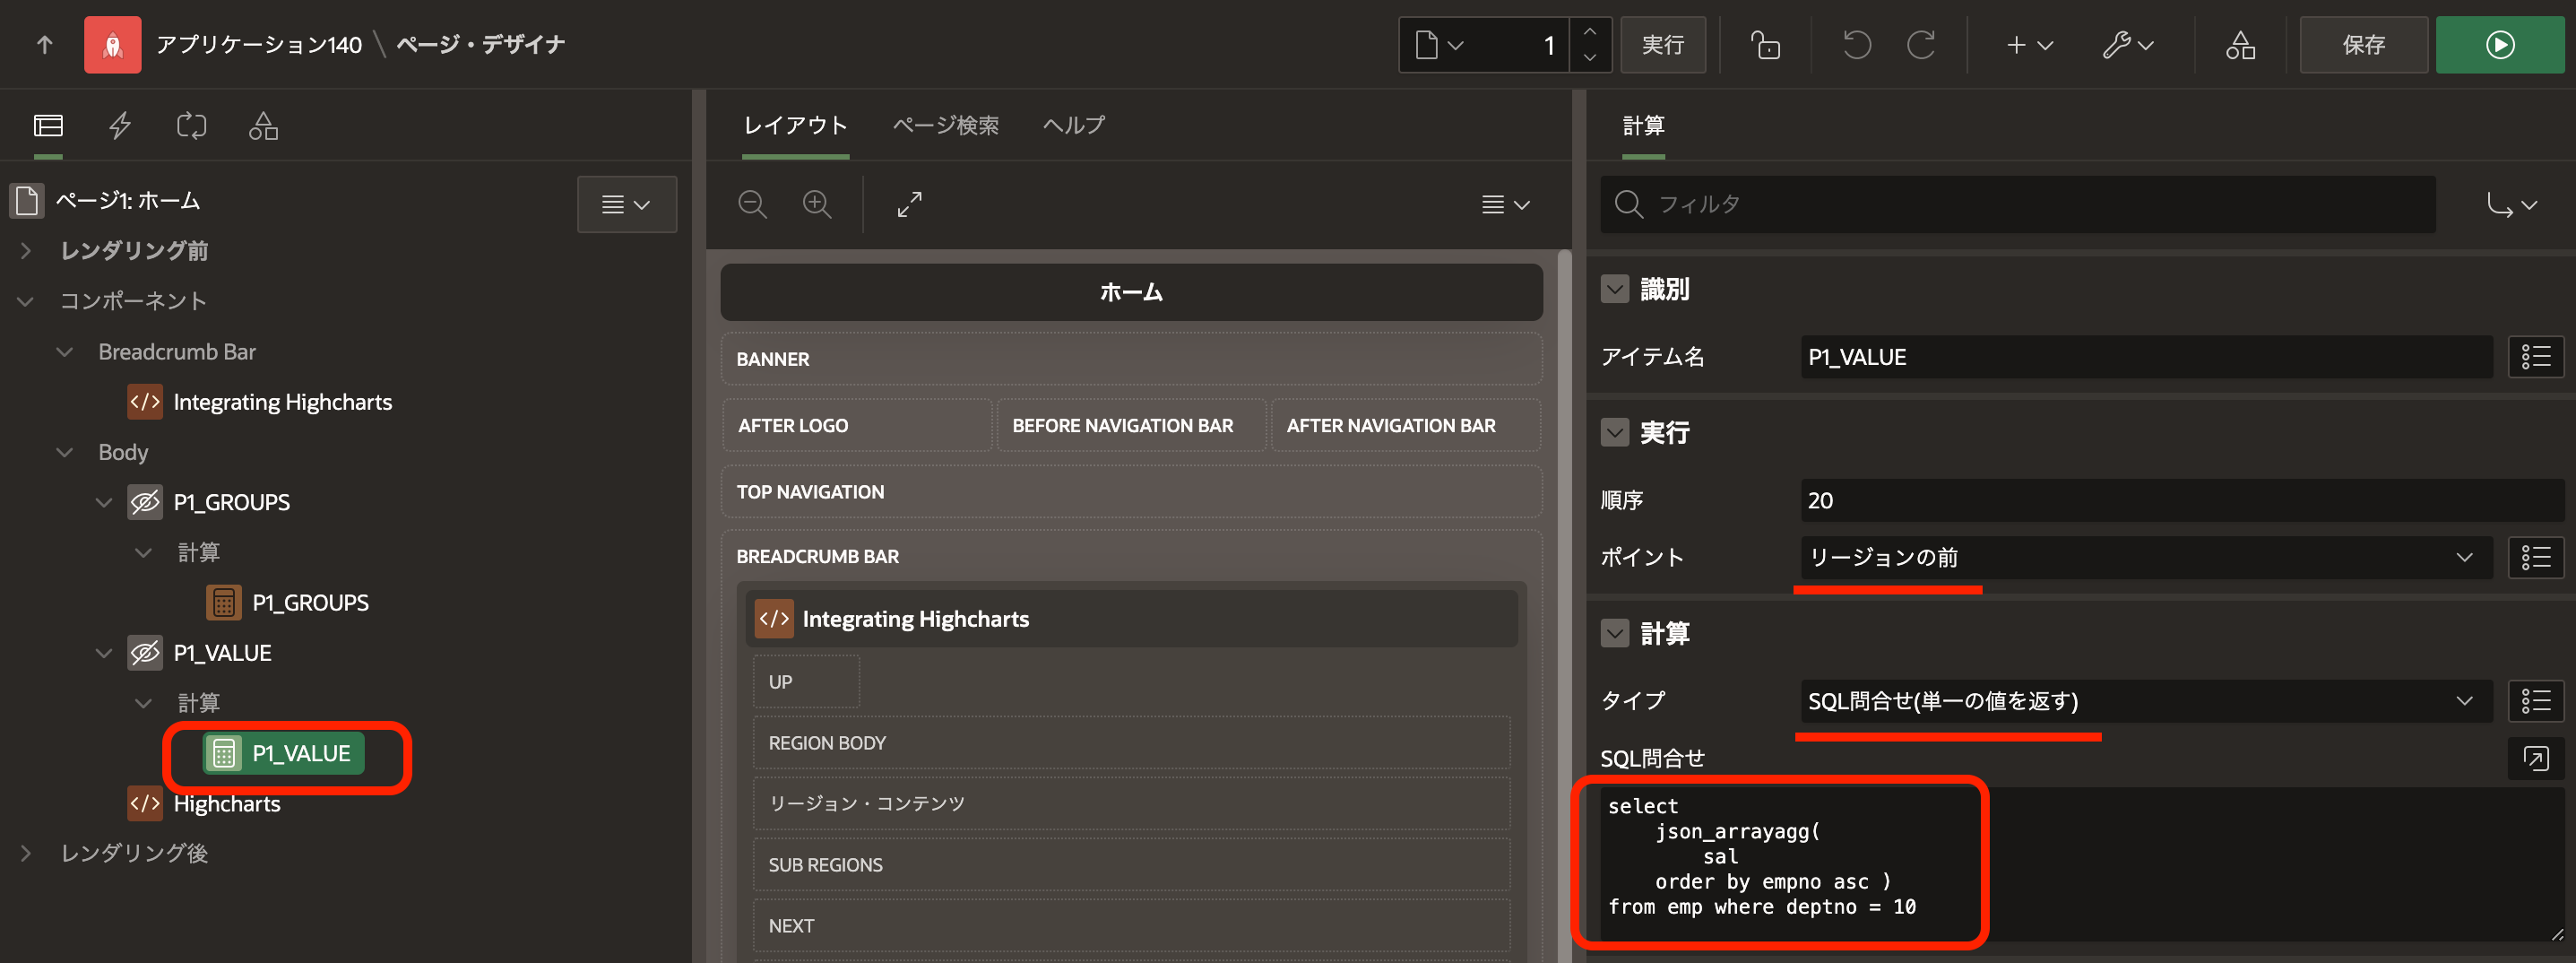
静的コンテンツのリージョンの名前をHighchartsとし、ソースのHTMLコードに以下を記述します。
This file contains bidirectional Unicode text that may be interpreted or compiled differently than what appears below. To review, open the file in an editor that reveals hidden Unicode characters.
Learn more about bidirectional Unicode characters
<div id="myChart"></div> | |
<script type="module"> | |
import Highcharts from 'highcharts'; | |
const groups = apex.item("P1_GROUPS").getValue(); | |
const value = apex.item("P1_VALUE").getValue(); | |
let config = { | |
chart: { | |
type: 'bar', | |
width: 400, | |
height: 200 | |
}, | |
title: { | |
text: '' | |
}, | |
xAxis: { | |
categories: JSON.parse(groups) | |
}, | |
yAxis: { | |
title: { | |
text: '' | |
}, | |
labels: { | |
format: '{value:.0f}' | |
} | |
}, | |
series: [{ | |
name: 'Salary', | |
data: JSON.parse(value), | |
color: '#309fdb', | |
showInLegend: false | |
}] | |
}; | |
let chart = Highcharts.chart('myChart', config); | |
</script> |
対話モード・レポートへの組み込み
対話モード・レポートのソースのSQL問合せとして以下を記述します。
select
dname,
json_arrayagg(
ename
order by empno asc ) groups,
json_arrayagg(
sal
order by empno asc) value,
'' chart
from emp_dept_v group by dname
列の書式のHTML式として以下を記述します。
This file contains bidirectional Unicode text that may be interpreted or compiled differently than what appears below. To review, open the file in an editor that reveals hidden Unicode characters.
Learn more about bidirectional Unicode characters
<div id="#APEX$DOM_ID#" class="w400"></div> | |
<script type="module"> | |
import Highcharts from 'highcharts'; | |
const groups = '#GROUPS!RAW#'; | |
const value = '#VALUE!RAW#'; | |
let config = { | |
chart: { | |
type: 'bar', | |
width: 400, | |
height: 200 | |
}, | |
title: { | |
text: '' | |
}, | |
xAxis: { | |
categories: JSON.parse(groups) | |
}, | |
yAxis: { | |
title: { | |
text: '' | |
}, | |
labels: { | |
format: '{value:.0f}' | |
} | |
}, | |
series: [{ | |
name: 'Salary', | |
data: JSON.parse(value), | |
color: '#309fdb', | |
showInLegend: false | |
}] | |
}; | |
let chart = Highcharts.chart('#APEX$DOM_ID#', config); | |
</script> |
以上で実装は完了です。ページを実行すると以下のように表示されます。
テンプレート・コンポーネントの作成
テンプレート・コンポーネントの名前はHighchats Bar Chartとしました。テンプレートの部分には以下を記述しています。
This file contains bidirectional Unicode text that may be interpreted or compiled differently than what appears below. To review, open the file in an editor that reveals hidden Unicode characters.
Learn more about bidirectional Unicode characters
<div id="#APEX$DOM_ID#" class="#CSS_CLASSES#"><div> | |
<script type="module"> | |
import Highcharts from 'highcharts'; | |
const groups = '#GROUPS#'; | |
const value = '#VALUE#'; | |
let config = { | |
chart: { | |
type: 'bar' | |
}, | |
title: { | |
text: '' | |
}, | |
xAxis: { | |
categories: JSON.parse(groups) | |
}, | |
yAxis: { | |
title: { | |
text: '' | |
}, | |
labels: { | |
format: '{value:.0f}' | |
} | |
}, | |
series: [{ | |
data: JSON.parse(value), | |
showInLegend: false | |
}] | |
}; | |
const color = '#COLOR#'; | |
if ( color ) { | |
config.series[0].color = color; | |
}; | |
const orientation = '#ORIENTATION#'; | |
if ( orientation !== null ) { | |
config.chart.type = orientation; | |
}; | |
const width = '#WIDTH#'; | |
if ( width ) { | |
config.chart.width = width; | |
}; | |
const height = '#HEIGHT#'; | |
if ( height ) { | |
config.chart.height = height; | |
}; | |
/* draw chart */ | |
let chart = Highcharts.chart('#APEX$DOM_ID#', config); | |
</script> |
カスタム属性としてCSS Classes、Groups、Value、Color、Orientation、Width、Heightを作成しています。GroupsとValueのタイプはセッション・ステート値、Colorはテキスト、WidthとHeightは両方とも整数です。
チャートの向きの指定であるOrientationの静的LOVは、horizontalの戻り値としてbar、verticalの戻り値としてcolumnを設定します。
対話モード・レポートにHighchartsのテンプレート・コンポーネントを実装します。
対話モード・レポートの列CHARTを選択し、識別のタイプをHighcharts Bar Chartに変更します。
設定のCSS Classesにw400、GroupsにGROUPS、ValueにVALUE、Colorに#309fdb、Orientationにhorizontalを設定します。Widthは400、Heightに200を設定します。
以上で実装は完了です。ページを実行すると以下のように表示されます。
今回の記事は以上になります。
作成したAPEXアプリケーションのエクスポートを以下に置きました。
https://github.com/ujnak/apexapps/blob/master/exports/integrating-highcharts-esm.zip
Oracle APEXのアプリケーション作成の参考になれば幸いです。
完